No technology blog would be complete without the obligatory reference to Big Data. While it is a hyped term, there’s no doubt that it does offer the potential to supercharge the value proposition of telematics. Not in the distant future, but very soon.
In the UK alone there were a total of 180,248 drivers on Microlise’s systems in 2017, burning around 1.9 billion litres of fuel and recording 90 million speeding, harsh cornering and harsh braking incidents.
These billions of miles of anonymised road data have the potential to deliver myriad opportunities to reduce risk and improve safety, increase productivity and bring about predictive analytics. The introduction of products enabled by Big Data will enable transport operators to understand risk in a whole new way and manage vehicle fleets in new ways too.
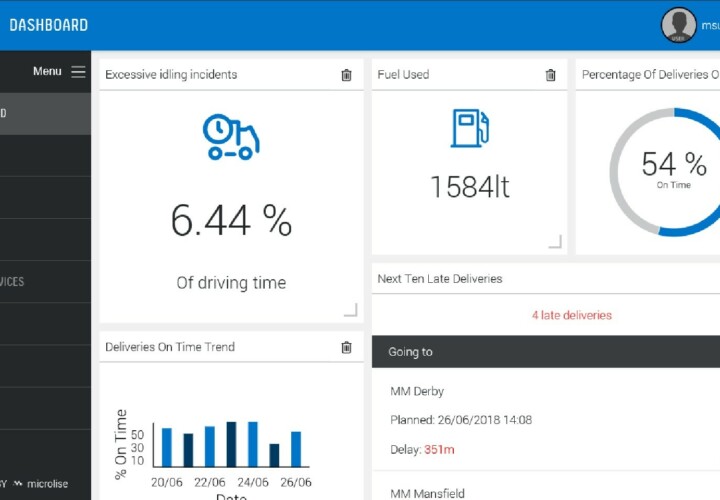
All that being said, what use is all of this data without the ability to cut through the noise and understand compelling information in an easy way? Well not a lot. Microlise Dashboards (available from release 18.6) are proving a very popular way to keep an eye on fleet key performance metrics.
Microlise Dashboards allow you to choose from a list of optional widgets and make them all viewable from a single screen. As a widget-based system the dashboard is highly flexible, enabling users to add and resize their chosen widgets to suit their requirements.
The variety of widgets available makes the dashboard a useful tool and in some instances, it can act as an early warning system allowing you to see where your fleet is underperforming. It’s also completely configurable, allowing you to choose the information you use on a regular basis and arrange it as you like it. So what are the widget options available right now?
DRIVERS CATEGORY
The driver widgets help you to find out, at a glance, how things are going that day. You can see whether drivers are performing in line with expectations, or if there has been a spike in activities which might lead to increased fuel usage or risk out on the roads.
Optional widgets are also available to see the number of contextual speeding incidents, excessive idling, harsh acceleration and braking that day. A count of incidents of overdriving per hour of driving can also be monitored.
FLEET PERFORMANCE CATEGORY
These widgets have been designed to enable you to keep a steady eye on your fleet’s performance.
They highlight the total distance driven, the amount of fuel used and a count of the number of times vehicles have entered no go areas that day. A chart, when selected, shows how the fleet is distributed by make and model and also the number of vehicles currently marked as off-road.
The dashboard can also be configured to flag the number of unread messages.
JOURNEYS CATEGORY
With our journey widgets, take a view of what the estimated delivery on-time percentage is for the end of the day based on the current situation. Meanwhile you can also review the trend of the last seven days to analyse whether or not combative measures are working, or indeed need further attention.
The Departing Journeys widget will highlight the next 10 journeys that are expected to depart along with their planned and estimated time of arrival. Another widget can display visits to sites that are estimated to be late.
In order to avoid unforeseen problems, the journeys which are missing either a driver, vehicle or trailer can also be displayed as three separate bars. The distance travelled by vehicles not on a journey can also be highlighted.
UPCOMING WIDGETS
The team continues to work on new widgets with more trend-based options coming very soon. Please be sure to check your list of available widgets regularly as new dashboard options will be added on an ongoing basis.


